Wealth Insights
Bonds Beckon with Higher Yields
5 minute read time
Bonds look attractive again after the most recent rise in interest rates. Markets are likely to continue to overreact to every new employment report and inflation reading, keeping interest rate volatility elevated as yields dance up and down with each data point. But today’s opportunity set is rich for both income investors and for those who need to rebalance their portfolios after another strong year for equities. We believe investors should take advantage.
Putting Today’s Yields in Context
I just celebrated my 15th anniversary in this business. When I started, the worst of the financial crisis had passed, but its ramifications would be felt for years. Early on I was focused primarily on fixed income, mostly buying municipal bonds for high-net-worth clients. It was fun, and challenging, not least because the defining characteristic of the post-financial crisis period was ultra-low interest rates. The Fed cut short-term rates to zero following the housing collapse in 2008 and kept them there for seven years. Not until 2018 did the Fed Funds rate breach 2%, and it wouldn’t exceed 2.5% until 2022 when pandemic-induced inflation and massive government spending forced the Fed to raise rates at breakneck pace, upending stocks and bonds alike.
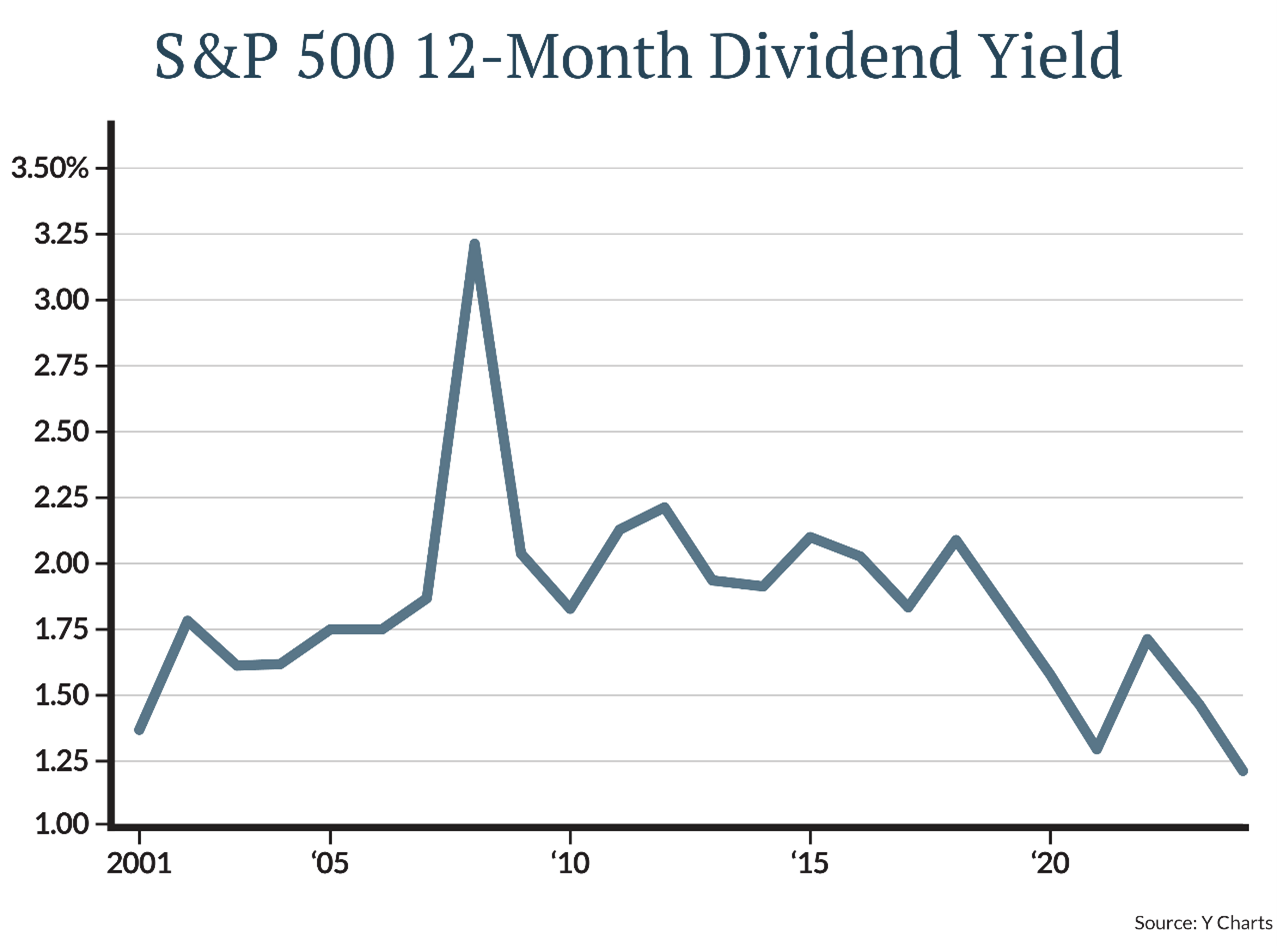
Buying bonds below the rate of inflation was unattractive for all but the most conservative investors during these years. A fixed-income allocation in balanced portfolios still served to dampen portfolio volatility, but you couldn’t get ahead without owning stocks. The T.I.N.A. (There Is No Alternative to stocks) trade was a real thing. The yield on the S&P 500 Index for most of these years was about 2%, similar to yields on investment-grade bonds, so many chose to accept the greater upside available in stocks despite their volatility.
Things have changed.
The S&P 500 today yields about 1.27%. This is the lowest level since 2001. The primary reasons for this are higher prices (especially after 20%+ returns in 2023 and 2024) and changing index composition. The index's dividend yield is the total dividends earned in a year divided by the index's price. Dividend payouts have simply not grown enough to offset the rise in the S&P 500’s price.

Index composition has been just as impactful. Many technology stocks pay little or no dividend, and as their growth has powered stocks higher, their share of the S&P 500 Index has risen to about 32%. Higher-yielding consumer staples are just 5.4%, and utilities, known for their slow, stable growth and steady dividend payouts, make up just 2.4% of the index. Yield-seeking investors can turn to products like the Vanguard High Dividend Yield ETF, but they may be surprised to learn that a “high” dividend today turns out to be about 2.7%. Allocating to dividend-paying stocks also means forgoing the fastest-growing companies, as dividend funds typically have small allocations to technology.
Bonds Increasingly Attractive
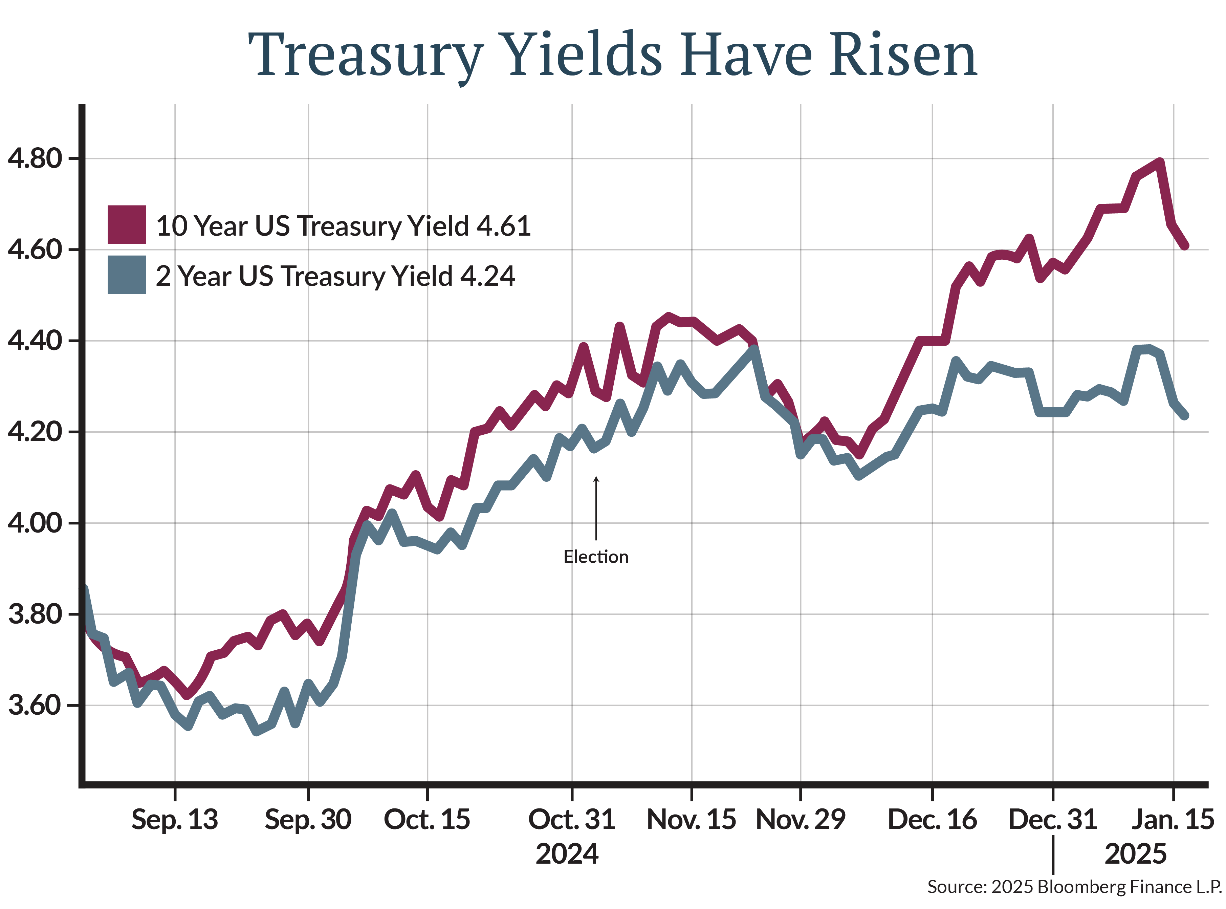
So, the days of building a diversified portfolio of 5%-yielding blue-chip stocks and living off the dividends are over. But so too are the days of zero interest rates, and the backup in yields that we have seen since the Fed’s 0.50% rate cut last September is enticing.
Just over three months ago, at the end of the third quarter of 2024, the 10-Year Treasury yield was 3.78%. Since then, a combination of factors has pushed that yield steadily higher. Robust employment gains, sticky inflation, and questions about the impact of Trump administration policies (tariffs, tax cuts, immigration reform) have combined to lead investors to expect fewer rate cuts in 2025 and demand greater compensation for buying longer-term bonds. The gap between the 2-Year Treasury yield and the 10-Year Treasury yield has widened since the election, resulting in a steeper yield curve that once again rewards investors for stepping out of cash. The 5-Year Treasury now yields 4.40%, and the 10-Year yields 4.60%. Intermediate-term corporate bonds yield 5.4%.

We believe the backup in yields presents an attractive entry point for investors, with starting yields in a diversified bond portfolio implying 4-5% annualized returns for high-quality portfolios over the next decade.
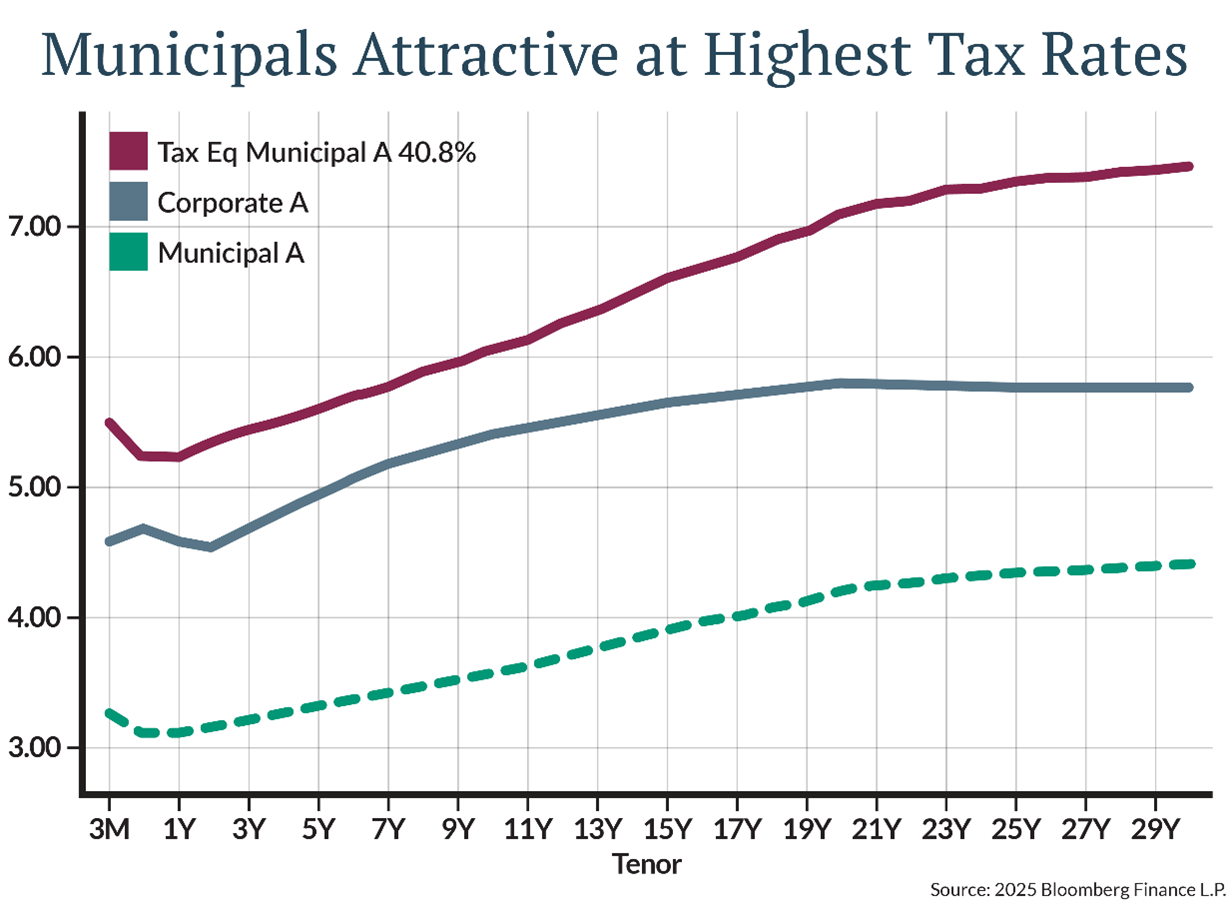
Tax-exempt municipal bonds are especially compelling, with taxable equivalent yields approaching 6-7% for investors subject to the highest tax brackets. Here it should be noted that as rates rise, so too does the value of tax exemption. A 3% tax-exempt yield is equivalent to about 5% taxable for an investor subject to the highest 40.8% tax, a gain of two percentage points over the nominal yield. At a 4% nominal yield, the taxable equivalent yield is about 6.67%, a gain of 2.67 percentage points over the nominal yield.

Stay Focused Amid the Data Dance
Stocks will always have one advantage over bonds. Unlike bonds with their fixed coupon payments, equities grow their earnings and increase dividend payments over time. It may take some time for the S&P 500 to grow into today’s lofty valuations and meager dividend payouts, but stocks will always be a better inflation hedge than bonds.
Still, with dividend yields providing little cushion for equity investors and bond yields rising, it may make sense to take advantage of today’s higher coupons to add a measure of stability to portfolios. Bond yields will continue to dance around each new data point, and market narratives will turn on a dime. Amid the volatility, we suggest investors stay focused on adding quality income to portfolios when opportunity knocks.
Read our 2025 Investment Economic Outlook
Read our report providing our outlook on the economy, markets and how we’re currently positioning portfolios.
This information is for educational and illustrative purposes only and should not be used or construed as financial advice, an offer to sell, a solicitation, an offer to buy or a recommendation for any security. Opinions expressed herein are as of the date of this report and do not necessarily represent the views of Johnson Financial Group and/or its affiliates. Johnson Financial Group and/or its affiliates may issue reports or have opinions that are inconsistent with this report. Johnson Financial Group and/or its affiliates do not warrant the accuracy or completeness of information contained herein. Such information is subject to change without notice and is not intended to influence your investment decisions. Johnson Financial Group and/or its affiliates do not provide legal or tax advice to clients. You should review your particular circumstances with your independent legal and tax advisors. Whether any planned tax result is realized by you depends on the specific facts of your own situation at the time your taxes are prepared. Past performance is no guarantee of future results. All performance data, while deemed obtained from reliable sources, are not guaranteed for accuracy. Not for use as a primary basis of investment decisions. Not to be construed to meet the needs of any particular investor. Asset allocation and diversification do not assure or guarantee better performance and cannot eliminate the risk of investment losses. Certain investments, like real estate, equity investments and fixed income securities, carry a certain degree of risk and may not be suitable for all investors. An investor could lose all or a substantial amount of his or her investment. Johnson Financial Group is the parent company of Johnson Bank and Johnson Wealth Inc. NOT FDIC INSURED * NO BANK GUARANTEE * MAY LOSE VALUE